What Return Assumption Should You Use in Your Retirement Income Plan?
Your spreadsheet says you’re fine. But is it telling the truth?

Most retirement income planning starts with a spreadsheet. You plug in your capital, your desired income, an escalation rate, and a return assumption. The tool does the arithmetic and tells you whether you’ll be okay.
The problem is that single return assumption. Get it right, and the plan is a useful guide. Get it wrong, and it’s a comfortable fiction.
I’ve built a calibration table that connects the return assumption in a simple planning tool to the probability of success from a Monte Carlo simulation: 10,000 randomly generated market scenarios, a 60% equity portfolio, and a 30-year retirement horizon. This lets us answer the question: when you plug in a return number, what are you actually saying about the odds?
Key takeaways
A real return assumption of 3.5% or lower maps to a plan with better than 90% probability of success. That’s the “green zone.”
A 4% real return assumption corresponds to roughly 85% probability of success: a reasonable, well-calibrated starting point for most retirees.
Above 4.5% real, the probability drops sharply. A plan built on 5% or 6% real returns may look fine on paper, but the odds are increasingly against it in the real world.
Volatility imposes a penalty on withdrawal rates that a straight-line tool cannot capture. Even if your portfolio achieves a 7% real return over 30 years, the path it takes to get there means your sustainable withdrawal rate is materially lower than 7%.
Why a straight-line return assumption is misleading
Here’s the core issue. A spreadsheet assumes the portfolio earns a steady return every single year. In reality, returns are volatile: some years are strong, some are deeply negative, and the order of those years matters enormously. This is sequence of returns risk which I’ve written about it before.
When you are withdrawing income from a portfolio, bad returns early in retirement do permanent damage. Capital lost early never gets the chance to compound. This is why a portfolio that averages 7% real over 30 years cannot safely support a 7% withdrawal rate. The volatility along the way is a tax on the withdrawal rate, and no simple planning tool accounts for it.
A Monte Carlo simulation does. By running thousands of possible return paths, it captures what the spreadsheet misses: the penalty that volatility imposes on a decumulating portfolio.
The calibration table
The table below maps each real return assumption (nominal return minus income escalation) to the implied probability of success over a 30-year horizon at 60% equity.
The spending strategy assumed here is the combined “Smile and Forgo” approach: spending steps down naturally in the later decades of retirement (the retirement smile), and the inflation increase is skipped in any year where the market was negative (the forgo rule). I’ve covered both of these in detail in previous articles.
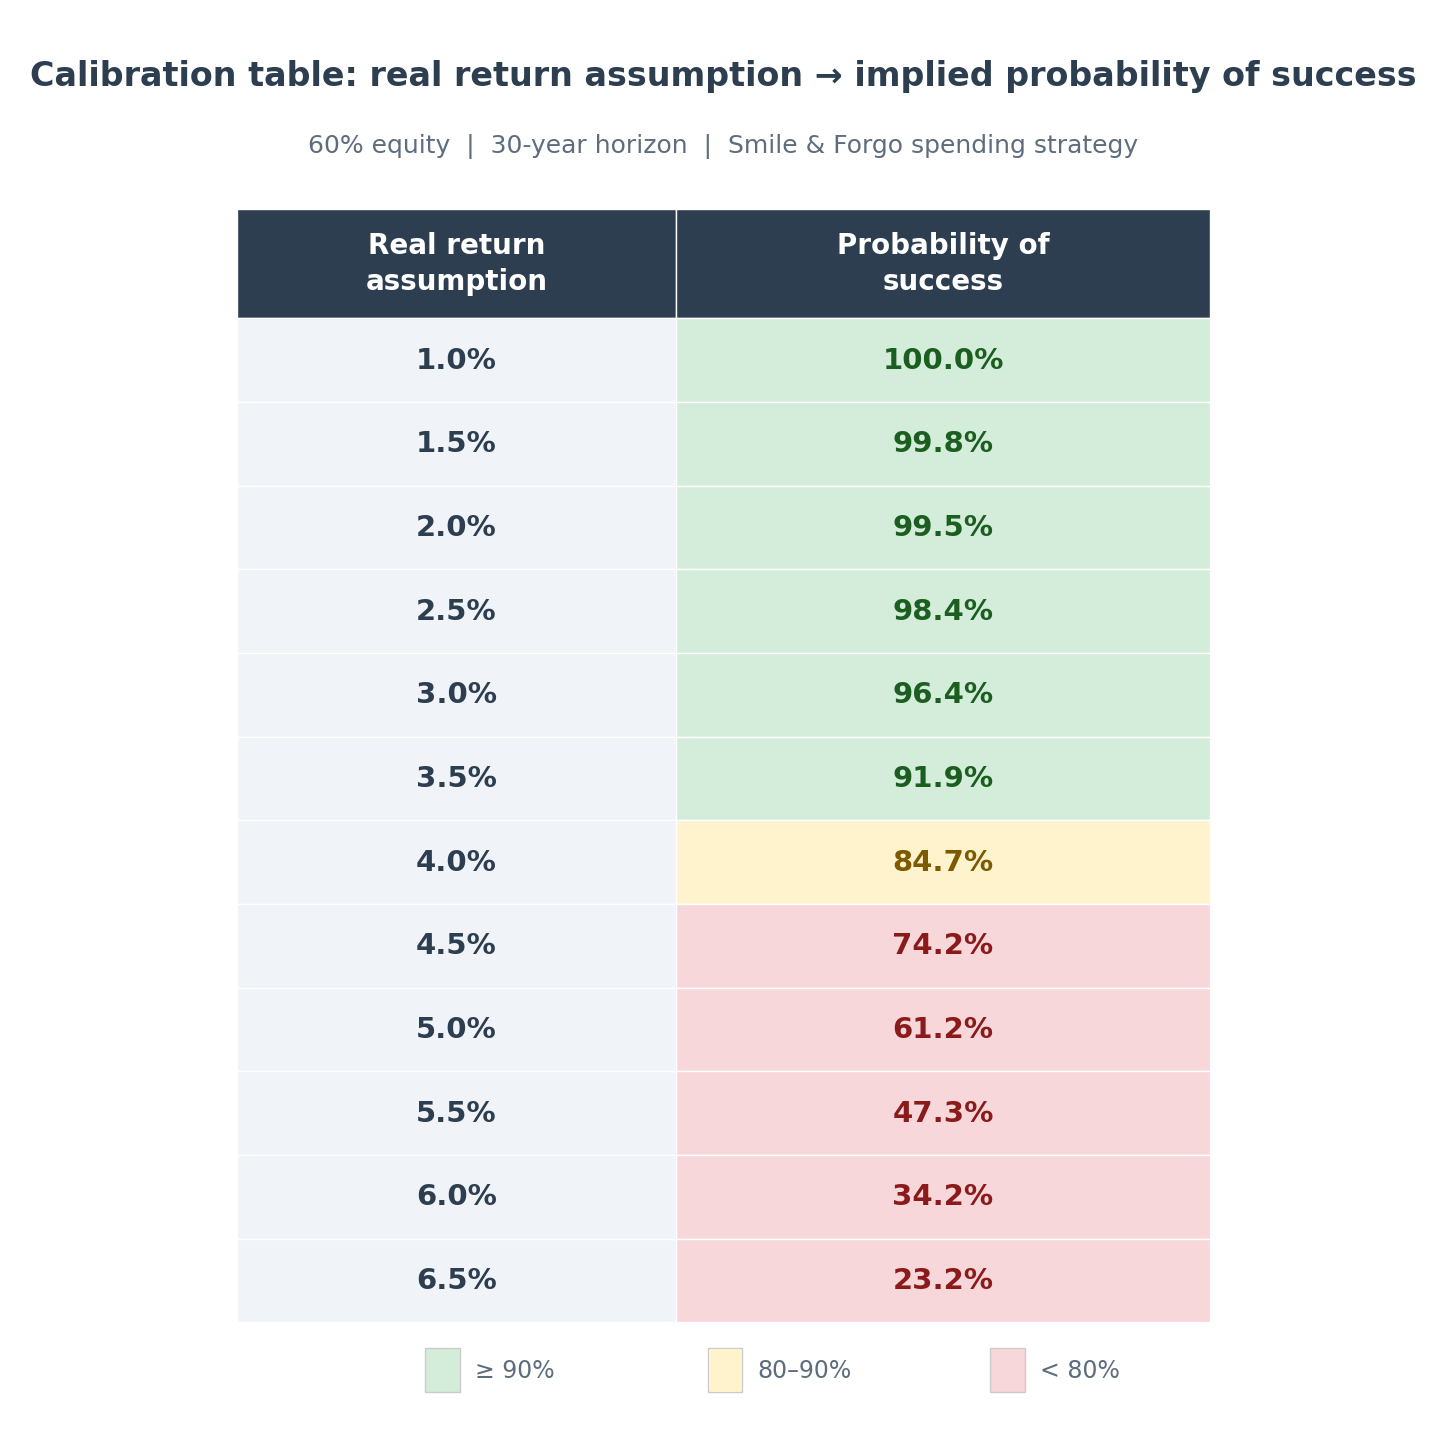
The pattern is clear. Below 3.5% real, you’re in the green zone: better than 90% probability of success. At 4% real, you’re in amber territory: roughly 85%, which is a sensible and well-calibrated position for a flexible retiree. Above 4.5%, the odds deteriorate quickly. By 6% real, your plan has only a 34% chance of surviving the full 30 years.
For clarity, assuming a 10% annual return and an inflation assumption of 5% is effectively assuming a 5% real return.
The temptation to “solve” the problem on paper
This is where the danger lies. If a plan doesn’t work at 4% real, it’s tempting to push the return assumption to 5% or 6%. The spreadsheet will oblige: it will show the plan as fully funded. But the calibration table reveals what that assumption actually implies. At 5% real, you’re accepting a 61% probability of success. At 6%, it’s 34%. The plan hasn’t been fixed. The assumptions have been loosened until the answer looks acceptable.
A higher return assumption isn’t a strategy. It’s a hope.
A note on flexibility
This analysis assumes the retiree is willing to be flexible: allowing spending to decline naturally over time and skipping the inflation increase after a negative market year. I’ve shown previously that this flexibility is not particularly costly: the typical retiree skips the inflation increase about 3 times in 30 years, and over 87% of simulated scenarios the flexible strategy delivers higher total lifetime spending than the rigid alternative.
But flexibility must be genuine. If your essential expenses consume all of your retirement income and there is no room to adjust, then these probabilities do not apply to you in the same way. In that case, a living annuity may not be the right vehicle for all of your income and a guaranteed annuity should likely be considered. The flexibility assumption is not a free upgrade; it requires that your spending structure can actually absorb the adjustment.
Finding the balance
The calibration table is about honesty, not pessimism. An assumption of 2% real is conservative enough that almost no one would fail, but it’s also so restrictive that it may force you to live on less than you can comfortably afford. The answer isn’t to plan for the worst case. It’s to plan with clear-eyed realism about what each assumption implies.
For most retirees with a diversified 60% equity portfolio and genuine spending flexibility, a real return assumption between 3% and 4% strikes a sensible balance: a probability of success between 85% and 96%. That’s the range where the plan is robust without being unnecessarily punitive.
Get in touch for advice on your retirement income plan: jonathan@rexsolom.co.za
I work with clients in both English and Afrikaans.